Background
This article introduces a new approach to the prevention of osteoporotic fractures. Up to now the emphasis has been
on trying to detect osteoporosis, at an early phase of the disease, in time to give effective therapy. However, osteoporotic
fracture prevention is going through a quiet revolution regarding who to screen, who to test and who to treat. Underlying
this change is a paradigm shift away from making a diagnosis of osteoporosis to a multi-factorial assessment of osteoporotic
fracture risk. The model used for this is endorsed by WHO and is called FRAX.
This change can be compared to the evolution in the approach to management of cardiovascular disease over the last 30
years. During this period there has been a shift of emphasis from the diagnosis of a disease, such as ischaemic heart
disease, to the current approach to prevention which focuses on multi-factorial analysis of cardiovascular risk, with
recommendations of lifestyle and therapeutic interventions depending on the severity of risk of an adverse event.
Relying on bone mineral density is not enough
Screening for and treating osteoporosis has, until recently, been the only way to try and reduce fragility fractures.
Diagnosing osteoporosis requires assessment of bone mineral density (BMD) with a DEXA.
There is a strong association between low BMD and fracture risk. However the majority of fragility fractures (in postmenopausal
women) occur in those without osteoporosis (T-score <-2.5). For example the proportion of women aged 50 diagnosed with
osteoporosis is about 5%, however approximately 20% will suffer from a fragility fracture in the next 10 years. It is
apparent that measurement of BMD alone only captures a minority of the fracture risk.
The cause of fragility fracture is increasingly recognised as multi-factorial, with risk factors that act independently
of BMD and loss of bone with age. For example between the ages of 50-90 years the annual incidence of hip fracture would
be expected to increase fourfold if based on age-related bone loss alone. But other risk factors make the actual increase
closer to 30-fold.
Improving assessment of fracture risk with FRAX
The WHO Collaborating Centre for Metabolic Bone Diseases at Sheffield has developed the FRAX tool to calculate the probability
of an osteoporotic fracture based on a variety of established clinical risk factors, using either a body mass index (BMI)
or a BMD T-score. The major advantage of FRAX is that it provides a better predictor of fragility fracture risk than BMD
alone and hopefully will lead to significant reduction in osteoporotic fractures.
The FRAX online calculator which is freely available at www.shef.ac.uk/FRAX (Figure
1) allows the calculation of an individual’s probability of a fragility fracture. The same calculator is used if
BMD is not available. The BMD box is simply left blank.
Risk tables (similar to cardiovascular risk tables) developed from the FRAX tool, are also available at the same site
and have been included with this document as a reference tool.
The online tool provides a more accurate estimate than the paper based tables as it gives weightings to the different
clinical risk factors according their predictive strength. In general, smoking and alcohol are weak risk factors, glucocorticoid
use and secondary causes of osteoporosis are moderate risk factors, and a prior fracture (in men) and a parental history
of hip fracture are strong risk factors. The paper based risk tables don’t weight the risk factors instead an average
probability is provided.
How does FRAX work?
Assessing an individual patients risk where there is no BMD measurement
| Some clinical risk factors are so strong that even if the BMD is normal osteoporotic
treatment is advised e.g. prior fragility fracture. |
To assess an individual patient’s risk, where there is no BMD measurement, the probability of a fragility fracture
is calculated according to age, gender, BMI and the number of clinical risk factors present. (Note BMI is used as a surrogate
for BMD as while a low BMI is a significant risk factor for hip fracture, its value in predicting other fractures is less
than a BMD T-score at the femoral neck.)
The clinical risk factors for assessment of fragility fracture probability using FRAX are shown in Table 1 below.
Table 1: Clinical risk factors for assessment of fragility fracture probability
| Clinical risk factors |
|
- Age
- Sex
- Low body mass index
- Previous fragility fracture, particularly of the hip, wrist and spine including radiographic evidence of 20% loss
of height of a vertebral body
- Parental history of hip fracture
- Current glucocorticoid treatment (any dose, by mouth for 3 months or more)
- Current smoking
- Alcohol intake of 3 or more units daily
|
- Secondary causes of osteoporosis including:
- Rheumatoid arthritis
- Untreated hypogonadism in men and women
- Prolonged immobility
- Organ transplantation
- Type 1 diabetes
- Hyperthyroidism
- Gastrointestinal disease
- Chronic liver disease
- Chronic obstructive pulmonary disease
|
Example 1: Assessing an individual patients risk where there is no BMD measurement
Using risk tables calculated using the FRAX tool, the probabilities of a fragility fracture can be estimated based on
gender, age, BMI and the number of additional clinical risk factors. Note: additional clinical risk factors refers to
those other than gender, age, and BMI.
For example: a woman aged 60 with a BMI of 20 and two
additional clinical risk factors would have a probability of a having major osteoporotic fracture of 15% in
the next ten years.
FRAX Risk Tables: WOMEN with no previous fracture
| No of CRFs |
Age 50 |
| 0 |
3.9 |
3.6 |
3.5 |
3.0 |
2.6 |
| 1 |
6.3 |
5.7 |
5.4 |
4.7 |
4.1 |
| 2 |
9.9 |
8.8 |
8.2 |
7.2 |
6.3 |
| 3 |
15 |
13 |
12 |
11 |
9.5 |
| |
15 |
20 |
25 |
30 |
35 |
| |
BMI |
|
| No of CRFs |
Age 60 |
| 0 |
7.4 |
6.5 |
6.0 |
5.2 |
4.6 |
| 1 |
12 |
10 |
9.3 |
8.1 |
7.0 |
| 2 |
18 |
15 |
14 |
12 |
11 |
| 3 |
27 |
23 |
20 |
18 |
16 |
| |
15 |
20 |
25 |
30 |
35 |
| |
BMI |
|
| No of CRFs |
Age 70 |
| 0 |
14 |
12 |
11 |
9.5 |
8.2 |
| 1 |
21 |
18 |
16 |
14 |
12 |
| 2 |
31 |
26 |
23 |
20 |
17 |
| 3 |
44 |
37 |
32 |
28 |
24 |
| |
15 |
20 |
25 |
30 |
35 |
| |
BMI |
|
| No of CRFs |
Age 80 |
| 0 |
22 |
19 |
17 |
15 |
12 |
| 1 |
32 |
28 |
25 |
21 |
18 |
| 2 |
44 |
40 |
35 |
30 |
25 |
| 3 |
56 |
52 |
47 |
41 |
35 |
| |
15 |
20 |
25 |
30 |
35 |
| |
BMI |
|
Example 2: Assessing an individual patients risk where there is a BMD measurement
To assess an individual patient’s risk where there is a BMD measurement the probability of a fragility fracture
is calculated as above except that the BMD T-score at the femoral neck is substituted for BMI.
For example: a woman aged 70 with a BMD of -4 and two
additional clinical risk factors would have a probability of a having major osteoporotic fracture of 54% in
the next ten years.
FRAX Risk Tables: WOMEN with no previous fracture
| No of CRFs |
Age 50 |
| 1 |
26 |
13 |
7.6 |
5.5 |
4.8 |
| 2 |
37 |
19 |
11 |
8.1 |
7.0 |
| 3 |
51 |
27 |
16 |
12 |
10 |
| |
-4 |
-3 |
-2 |
-1 |
0 |
| |
BMD |
|
| No of CRFs |
Age 60 |
| 1 |
32 |
18 |
11 |
8.0 |
6.8 |
| 2 |
44 |
25 |
16 |
12 |
9.8 |
| 3 |
58 |
35 |
23 |
16 |
14 |
| |
-4 |
-3 |
-2 |
-1 |
0 |
| |
BMD |
|
| No of CRFs |
Age 70 |
| 1 |
41 |
25 |
15 |
11 |
8.9 |
| 2 |
54 |
34 |
21 |
15 |
12 |
| 3 |
67 |
45 |
29 |
20 |
16 |
| |
-4 |
-3 |
-2 |
-1 |
0 |
| |
BMD |
|
| No of CRFs |
Age 80 |
| 1 |
45 |
29 |
19 |
13 |
9.6 |
| 2 |
57 |
40 |
26 |
18 |
13 |
| 3 |
67 |
51 |
35 |
25 |
17 |
| |
-4 |
-3 |
-2 |
-1 |
0 |
| |
BMD |
|
| The use of FRAX does not exclude clinical judgement. Some patients at risk of
fragility fracture can not be accurately assessed using the FRAX model, for example women with anorexia nervosa, and
will need to be identified opportunistically. |
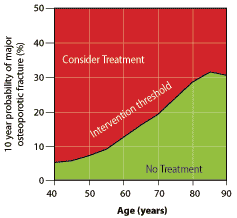
Intervention thresholds
Intervention thresholds have been suggested by the National Osteoporosis Guideline Group (NOGG) for the UK.
Assessment with BMD
Where the risk has been estimated using BMD an intervention threshold has been suggested. This threshold is equivalent
to that associated with a prior fracture, and therefore rises with age. |
 |
Assessment without BMD
Where the risk has been calculated using BMI an intermediate category (orange) is used indicating that probabilities
lie on the border of the intervention threshold. The NOGG recommend that in this instance a BMD T-score is obtained
to better characterise the risk. |
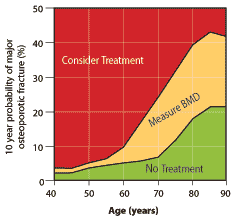 |
These intervention thresholds have been incorporated into risk tables in a similar way to the colour coding of the New
Zealand cardiovascular risk tables.
- Green denotes that an individual’s risk lies below the intervention threshold
i.e. treatment is not indicated
- Orange denotes that probabilities lie between in an intermediate zone between reassurance
and treatment and that a BMD should be considered to improve the estimate of fracture risk.
- Red denotes the fracture probability is consistently above the upper assessment threshold,
irrespective of the mix of clinical risk factors, so that treatment can generally be strongly recommended.
FRAX risk tables with intervention thresholds
This is an example. For the full tables see the pull out section.
WOMEN with no previous fracture
| No of CRFs |
Age 50 |
| 0 |
3.9 |
3.6 |
3.5 |
3.0 |
2.6 |
| 1 |
6.3 |
5.7 |
5.4 |
4.7 |
4.1 |
| 2 |
9.9 |
8.8 |
8.2 |
7.2 |
6.3 |
| 3 |
15 |
13 |
12 |
11 |
9.5 |
| |
15 |
20 |
25 |
30 |
35 |
| |
BMI |
|
| No of CRFs |
Age 60 |
| 0 |
7.4 |
6.5 |
6.0 |
5.2 |
4.6 |
| 1 |
12 |
10 |
9.3 |
8.1 |
7.0 |
| 2 |
18 |
15 |
14 |
12 |
11 |
| 3 |
27 |
23 |
20 |
18 |
16 |
| |
15 |
20 |
25 |
30 |
35 |
| |
BMI |
|
| No of CRFs |
Age 70 |
| 0 |
14 |
12 |
11 |
9.5 |
8.2 |
| 1 |
21 |
18 |
16 |
14 |
12 |
| 2 |
31 |
26 |
23 |
20 |
17 |
| 3 |
44 |
37 |
32 |
28 |
24 |
| |
15 |
20 |
25 |
30 |
35 |
| |
BMI |
|
| No of CRFs |
Age 80 |
| 0 |
22 |
19 |
17 |
15 |
12 |
| 1 |
32 |
28 |
25 |
21 |
18 |
| 2 |
44 |
40 |
35 |
30 |
25 |
| 3 |
56 |
52 |
47 |
41 |
35 |
| |
15 |
20 |
25 |
30 |
35 |
| |
BMI |
|
| |
Reassure |
|
Consider BMD test |
|
Consider Treatment |
Interventions thresholds in the New Zealand context
The major advantage of FRAX is that it provides a better predictor of fragility fracture risk than BMD alone.
Given the limited access to DEXA in NZ the FRAX tool offers a practical way for GPs to accurately assess a patient’s
risk of fragility fracture. This provides the opportunity to reassure patients at low risk, and target the use of DEXA
to those at high risk.
For more information on the prevention of osteoporotic fracture see BPJ
17. For further information about the FRAX tool, refer to: www.shef.ac.uk/FRAX